Unified AI Life Sciences App Suite Including CRM, MDM, Portals, Sunshine Act Reporting and more.
Unified AI Professional Services Automation Suite including CRM, Time Logs, CPQ, Portals and more.
Unified AI Manufacturers and Distributors App Suite including CRM, CPQ, Customer & Supplier Portals, Customer Service and more.
When reps are managing dozens of HCP and HCO interactions daily, it’s easy for critical tasks to slip through the cracks. Gridlex solves that with real-time, AI-powered recommended actions …
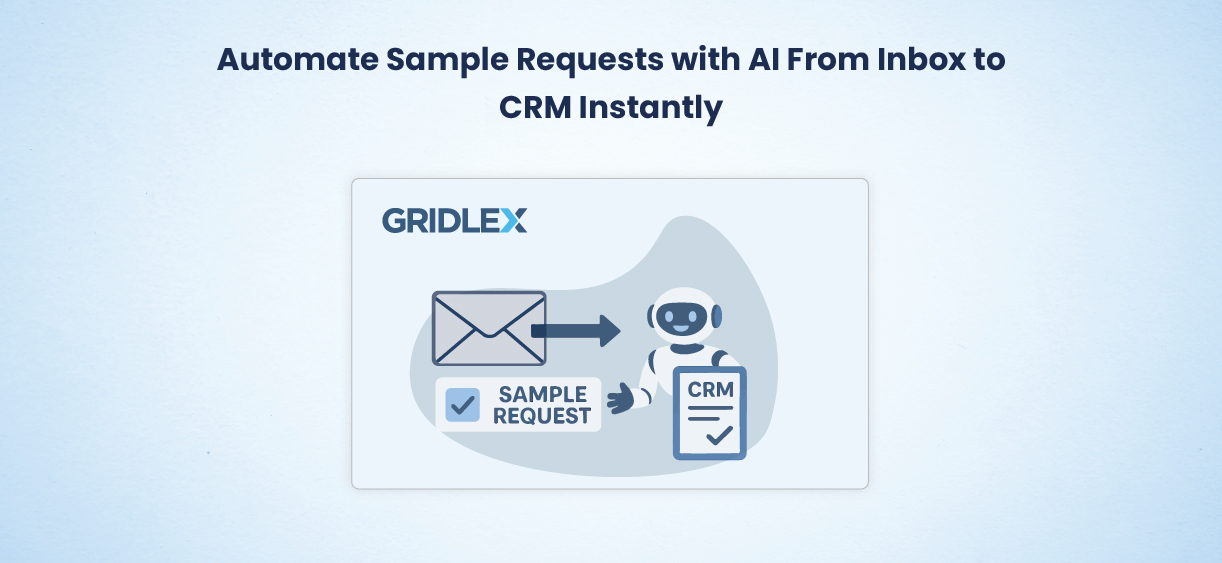
Sample request processing shouldn’t rely on inbox triage and manual follow-ups. Gridlex AI Agents streamline the entire workflow. When an HCP or HCO sends a request by email, the …
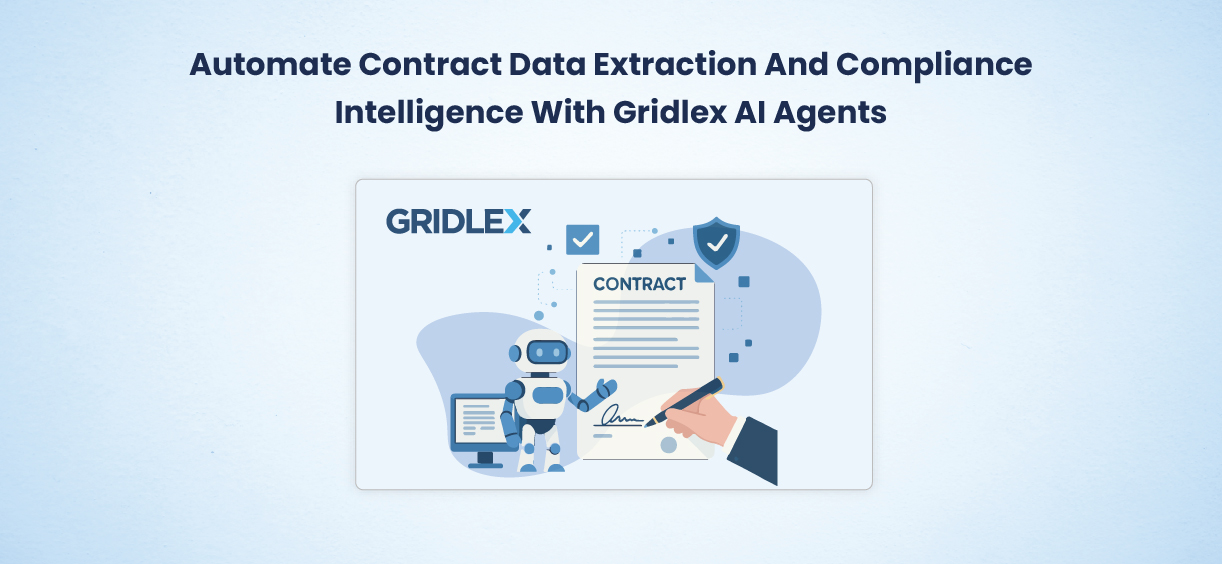
Medical device contracts are packed with critical terms—products, pricing, rebate tiers—but all buried in PDFs and emails. Teams waste hours copying data into spreadsheets, risking errors, missed rebates …
Architecture firms face nonstop revisions, requests, and compliance tasks—emails vanish, updates get missed, and key info slips away.There’s a smarter way. Gridlex AI Agents turn every client …

Government contractors face strict audits and tight deadlines—but ticketing chaos leads to lost emails, missed statuses, and critical gaps. But there’s a smarter way. Simplify ticketing for GovCon …

Engineering teams face constant pressure, but RFIs, tool requests, and field changes still arrive in scattered emails—delaying response and missing urgency. Gridlex AI Agents bring structure and speed to …
Reps in Lumber & Building Materials industry often rely on memory or old product lists to drive cross-sells and that means missed revenue. Gridlex AI Agents give LBM teams an edge …

Food & Beverage sales reps often pitch based on instinct or outdated playbooks. This leads to missed opportunities and low-value deals. But there’s a smarter way to cross-sell to existing …
Machinery, Equipment & Appliances distributors and manufacturers often face recalls tied to safety issues in specific models, lots, or defects. Manually tracking affected units and notifying customers takes time and adds …